Endurance Metrics: Contrasting Test Cricket Stamina with Hockey's Fast-Paced Demands
Alex Berger · Jun 10, 2026

Endurance Metrics: Contrasting Test Cricket Stamina with Hockey's Fast-Paced Demands
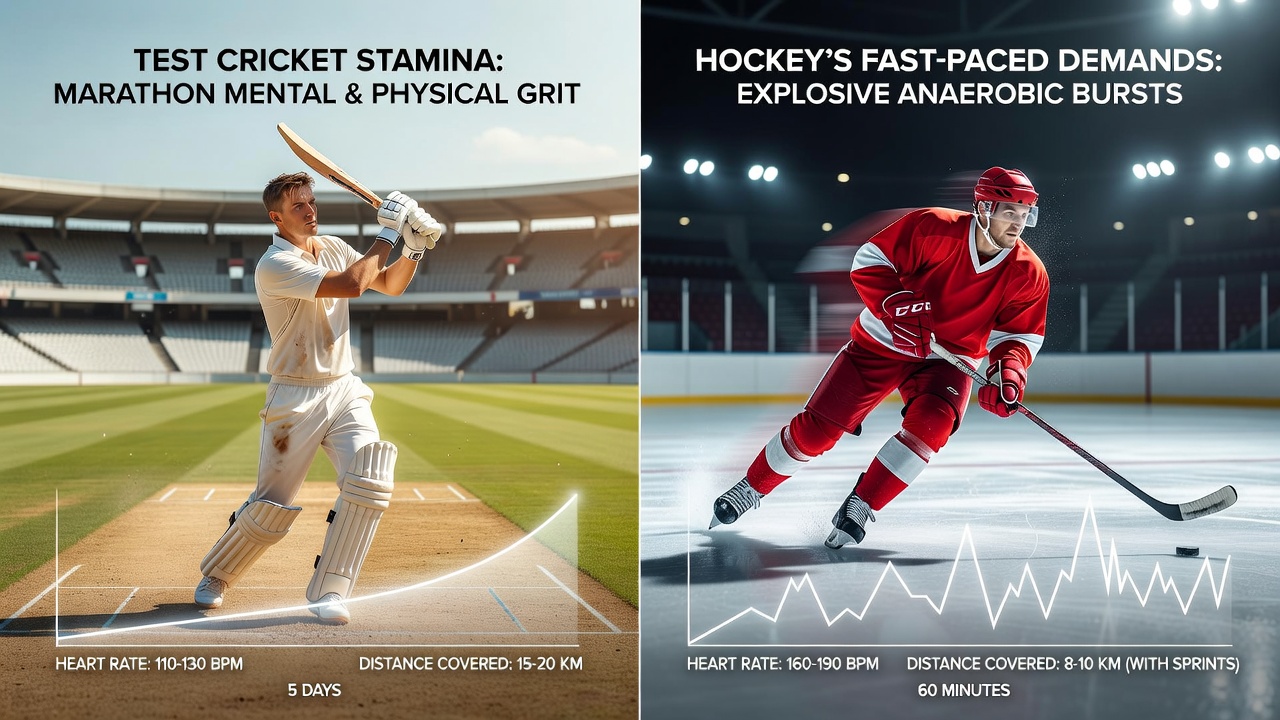
Endurance in elite sports takes distinct forms depending on the demands of each discipline, and Test cricket alongside field hockey illustrate this contrast clearly. Test matches stretch across five days with sessions lasting six hours or more each day, requiring sustained concentration and physical output from batters who face hundreds of deliveries and bowlers who deliver repeated spells. Field hockey matches run for 60 minutes of actual play divided into four quarters, yet they feature near-constant movement at varying intensities across a smaller pitch.
Physiological Foundations of Stamina
Researchers tracking athlete performance note that Test cricket leans heavily on aerobic capacity because players maintain low to moderate activity for extended periods while recovering between bursts of effort. Batters often spend hours at the crease executing shots and adjusting footwork, whereas bowlers complete run-ups and deliveries in sequences that accumulate over time. Data from physiological monitoring shows heart rates in cricket hovering in moderate zones for much of a session, with occasional spikes during intense moments like chasing boundaries or diving stops.
Hockey shifts the balance toward anaerobic systems and rapid recovery. Players cover distances through repeated sprints, directional changes, and stick work that elevate heart rates into high zones frequently. Studies conducted by Australian sports science groups indicate hockey athletes spend significant portions of a game above 85 percent of maximum heart rate, followed by brief recoveries that allow repeated high-output efforts within the same match.
Key Metrics Used to Measure Endurance
Performance analysts employ several standardized measures to quantify stamina differences. Total distance covered serves as one baseline, yet it reveals little without context on intensity. Cricket players might log 10 to 15 kilometers across a full day through walking between overs and fielding positions, while hockey players accumulate 8 to 12 kilometers in far shorter time frames with higher average speeds.
Work-to-rest ratios provide sharper contrast. In Test cricket these ratios stretch because bowlers rest between overs and batters pause between deliveries, creating recovery windows measured in minutes. Hockey ratios compress dramatically, often demanding repeated efforts every 10 to 20 seconds during open play. GPS tracking from professional leagues shows hockey athletes execute more than 300 high-intensity actions per match, a volume that tests lactate tolerance and phosphocreatine replenishment.
Training Approaches Reflecting Sport Demands
Coaches design preparation programs around these distinct profiles. Cricket conditioning sessions incorporate long-duration batting simulations and bowling workloads that replicate multi-day fatigue accumulation, often using weighted vests or extended net sessions. Recovery protocols emphasize sleep, nutrition timing, and active recovery walks between innings. Hockey programs prioritize interval training with short, sharp repetitions that mirror game patterns, including small-sided games and repeated sprint drills. Strength work focuses on lower-body power and core stability to support quick changes of direction.
One study from Canadian university researchers compared seasonal training loads and found cricket squads logging higher overall weekly volumes spread across months, whereas hockey teams concentrated high-intensity sessions into shorter preparation blocks before tournaments. Both approaches produce athletes capable of meeting their sport's unique endurance requirements, yet the methods diverge substantially.
Competition Schedules and Recovery Windows
Match calendars further shape endurance development. Test cricket features infrequent but lengthy fixtures, allowing multi-week preparation cycles and built-in rest between Tests. International schedules in 2025 and 2026 include extended series that test cumulative stamina across multiple matches. Hockey calendars pack more fixtures into shorter periods, with domestic leagues and international events requiring quick turnaround times between games. This density places greater emphasis on in-season recovery strategies such as cold-water immersion and nutrition protocols.
Observers tracking both sports note that injury patterns align with these endurance profiles. Cricket reports higher incidences of overuse conditions in bowlers and back issues in batters due to prolonged postures, while hockey sees more acute muscle strains and joint impacts from explosive movements.
Data Insights from Performance Tracking
According to figures released by performance analysis platforms used across professional leagues, elite Test cricketers maintain consistent output across 300 to 400 deliveries faced or bowled per innings without significant drop-off in key metrics like running speed between wickets. Hockey datasets reveal players sustain sprint speeds above 20 kilometers per hour for cumulative distances exceeding 1 kilometer per match despite the shorter duration. These numbers emerge from wearable technology that records accelerations, decelerations, and heart-rate variability in real time.
What's interesting is how both sports increasingly integrate data from multiple sources. Cricket teams combine video analysis of shot selection with GPS to understand energy expenditure, while hockey programs layer heart-rate data onto tactical formations to optimize substitutions. The result remains sport-specific endurance rather than a universal stamina template.
Conclusion
Endurance metrics ultimately reflect the structural realities of each game. Test cricket rewards the capacity to sustain performance across days with intermittent efforts and strategic pacing. Hockey demands repeated maximal outputs within compressed timeframes that test recovery speed and anaerobic power. Both require dedicated preparation, yet the physiological pathways and training emphases remain distinct, shaped by match length, movement patterns, and competition density. Athletes and support staff continue refining these approaches through ongoing measurement and adaptation.